
Optimizing Flight Speed to Improve L30 V2 Drone Spray Pattern
Introducción
The precision of drone-based chemical application is highly dependent on understanding the interaction between the aircraft’s rotors and the spray distribution. Our long-term goal is to optimize flight parameters—such as speed, height, and droplet size—to establish standardized best practices for drone-based applications that ensure effective agricultural treatments, uniform coverage, and minimal environmental drift.
The primary objective of this experimental trial was to evaluate flight speed as the critical variable in optimizing the spray pattern and ensuring deposit uniformity.
Materials and Methods
The experimental trial was conducted in May 2026 to evaluate the effect of flight speed on spray pattern. The methodology employed the following experimental configuration:
Equipment
- ABZ Innovation L30 V2 spraying drone equipped for agricultural chemical application. The test was conducted in collaboration with the ABZ Innovation team and ABZ drone pilots.
Flight Parameters
- Flight altitude: 3 m above ground.
- Working width: 8 m.
- Variable flight speeds tested: 6 m/s, 7 m/s, and 8 m/s.
- Each speed was tested in 5 replicate flights to ensure reliability.
- Application dose: 20 L/ha.
- Droplet size: 262 µm.
- Flight Direction: 176° SSE (South-Southeast).
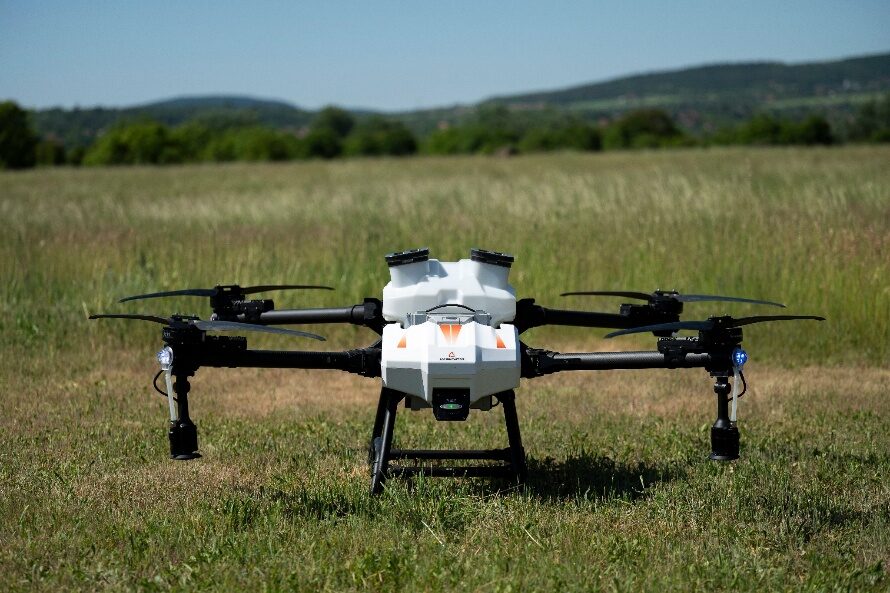
Image 1.: ABZ Innovation L30 V2 spraying drone
Environmental conditions
Temperature, humidity, and wind speed were recorded for each flight to account for potential spray drift.
- Temperature: Started at 22.6 °C and gradually rose to 23.6 °C by the end of the trial. This is an optimal operational range with no risk of rapid droplet evaporation.
- Relative Humidity: Decreased in parallel with the temperature rise, moving from 66.2% down to 62.7%.
- Wind Speed: Remained consistently low throughout the tests, ranging between 0.4 m/s and 1.3 m/s. Atmospheric movement was essentially negligible, preventing any major distortion of the spray pattern analysis.
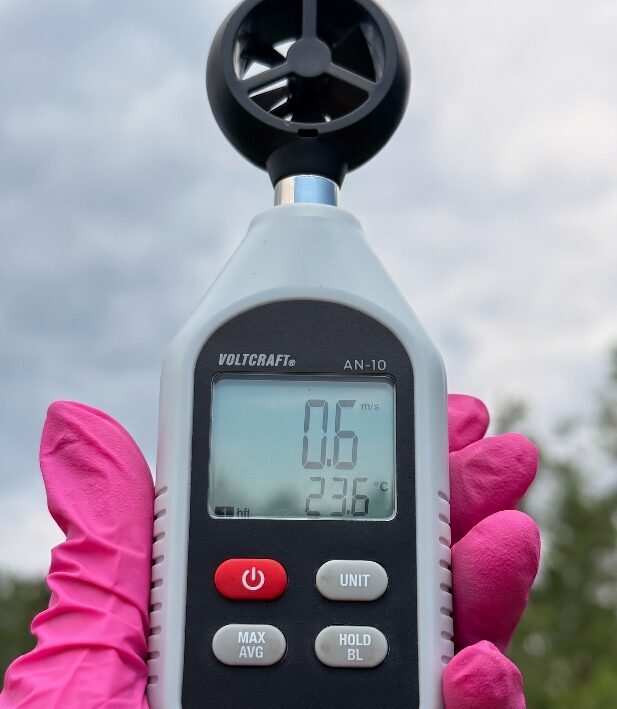
Image 2: The accurate measurement of wind speed is done using a simple handheld anemometer
Experimental Setup and Data collection
- To account for drift, water-sensitive paper strips were placed across a 25-meter width to assess spray pattern (number of droplets), with each speed repeated five times.
- After each flight, strips were collected, labeled, and analyzed for droplet density and distribution.
Results and discussion
Data collected from 15 test flights showed the distribution of droplet counts across the 8-meter span. Here we present the results of the experiment.
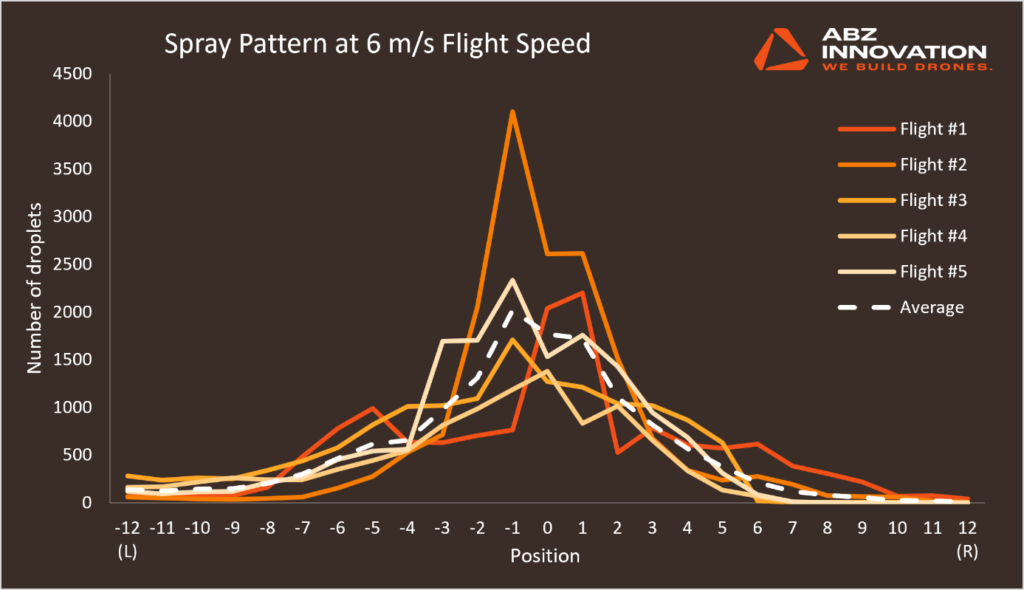
Based on the data from the 5 repetitions, the spray distribution at this lower speed exhibited pronounced, extreme localized peaks. At a flight speed of 6 m/s, the rotor downwash concentrates a significant portion of the spray volume directly beneath the flight path. This localized deposition leads to a much higher droplet density along the central axis than required, which can place unnecessary stress on the foliage. Such excessive local accumulation increases the risk of crop injury while resulting in less uniform overall swath coverage.

Increasing the flight speed to 7 m/s produces a noticeably more balanced spray pattern, as forward momentum and rotor downwash achieve a better equilibrium. The excessive accumulation in the central zone is reduced by nearly half compared to the slower pass, allowing droplet density to stabilize within a much safer and more optimal range. This speed is significantly gentler on the foliage while delivering a more predictable and well-balanced coverage across the working swath.

The highest tested speed of 8 m/s achieves the most uniform and finely dispersed spray distribution. Thanks to the increased forward speed and vortex dynamics, the droplets spread more widely across the swath, completely eliminating heavy central concentration. This setting provides maximum crop safety against potential foliage damage while delivering an ideal, evenly distributed droplet pattern and optimal operational efficiency.
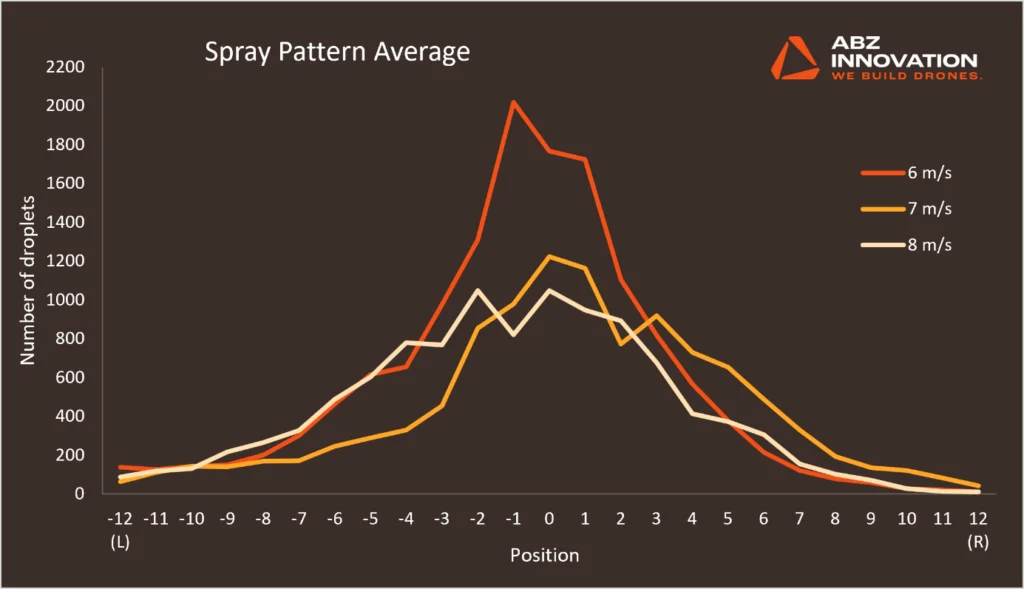
Operating at 8 m/s leverages aerodynamic vortex dynamics to spread droplets wider, maximizing field capacity (ha/h) without sacrificing application quality.
Resumen
The test results clearly demonstrate that optimizing flight speed is the key to efficient and safe drone application. While lower speeds (6 m/s) create localized over-application and potential foliage burn due to excessive downwash, operating at 7–8 m/s delivers a perfectly uniform and crop-safe spray distribution alongside higher field efficiency. The enhanced vortex dynamics at higher speeds eliminate chemical waste, ensuring that every drop of your crop protection product is used effectively and safely.
IMPORTANT NOTICE: This experiment serves strictly as a baseline. In practical commercial applications, spraying configurations, flow rates, and other flight parameters must always be adjusted dynamically to adapt to specific crop vegetation and field layouts, microclimates, and ambient environmental conditions.
Unauthorized reproduction or plagiarism of this work is strictly prohibited. Proper citation is required for any use of its content.


